Title: FACs experiment with the same conditions as the microscopy done to quantify the cell sizes for the pGAl1-Cdc42-sfGFP strains (II).
Contents
59. Title: FACs experiment with the same conditions as the microscopy done to quantify the cell sizes for the pGAl1-Cdc42-sfGFP strains (II).#
59.1. Date#
28012020-30012020
59.2. Objective#
To be able to compare the results of the FACs with the microscopy conditions. And also to see if we get a difference in expression when increasing the incubation temperature to 36C.
59.3. Method#
Insights from the Gal1 promoter
The location in the genome at which the gal promoter was inserted can have a strong effect on the expression pattern of the gal promoter (Ramon feedback). Hence we should not compare different studies of the Gal1 promoter with ours if the integration in the genome is in a different location and also if it is a plasmid or not.
We should compare systematically the Gal1p expression pattern of the strains that has the sfGFP (Werner strains) and the mneonGreen ones (Ramon/Miranda strains), because they have the same type of genomic integration of the Gal1 promoter.
Ask Reza for his data with WT+mneongreen to compare with mine
Look for the postprocessing results, in this folder
Follow the same protocol as I followed for the microscopy measurements
 {#fig:experimental-design}
Planned procedure
15 hours of incubation in 2% Gal +2% Raff (i.e. overnight incubation from 17:00 to 08:00 )
Washing step with CSM+2% Raff+0%Gal to the respective Galactose (at 08:00-09:00) concentrations. Incubate
Measure FACs after 24 hours of incubation . (next day of the washing step)
Use the references cdc42-GFP ywkd038 and ywkd001 in 2% dextrose +2% Raff, in CSM-met and CSM respectively.
In order to have the same conditions as the microscopy done in December 2018 , where we quantify the cell sizes after 24 hours of incubation in X% galactose (after a washing step from a firsto overnight incubation in 2% galactose), the media has to have 4x the normal amount of aminoacids. This maybe has an impact on the regulation of the promoter.
The new plate design for this is shown in @fig:plate-design
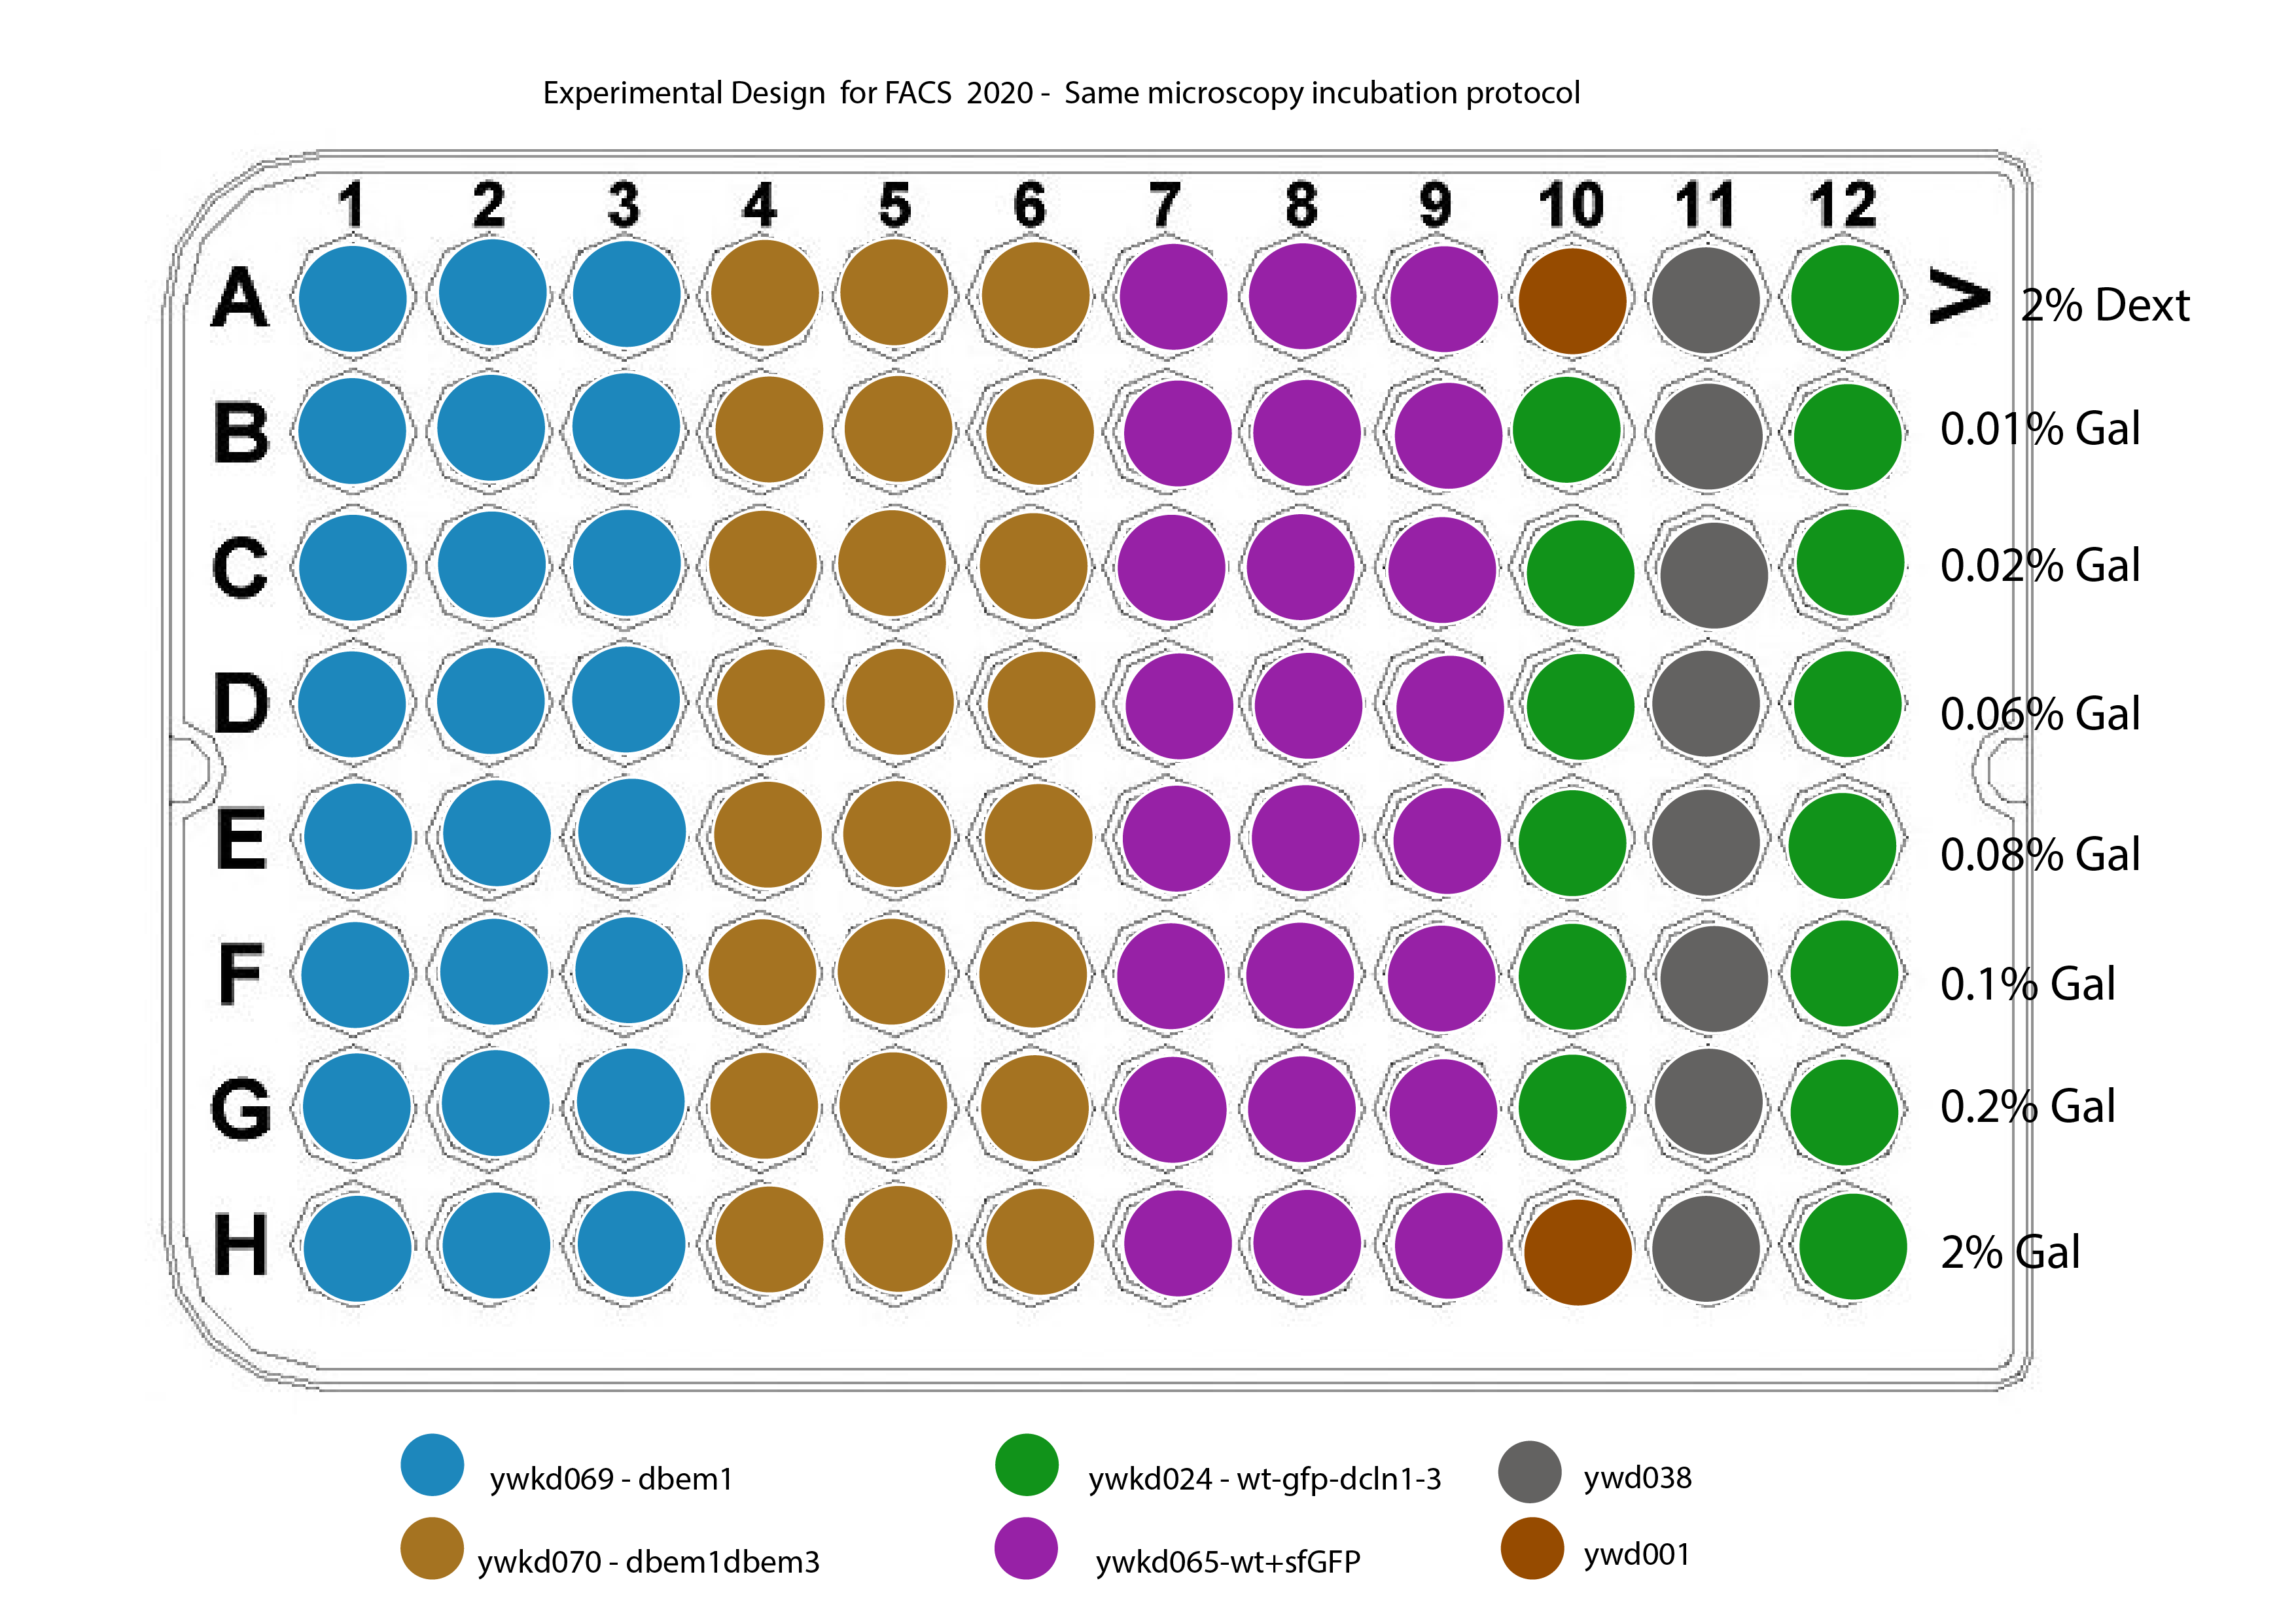 {#fig:plate-design width=50% height=50% }
The strain ywkd024 will be measured to still compared with previous measurements done by Marit, in 2017.
Strains :
ywkd024 : RWS119 Wedlich-Söldner Lab collection a W303 can 1 1-100 his3 11,15 Galpr-myc-GFP-CDC42 YipLac204-MET-CLN2 cln1\(\Delta\)::HisG, cln2\(\Delta\), cln3\(\Delta\)::HisG (strain to compare with ywkd065(sfGFP))
ywkd065a New YWKD055c W303 URA-Gal1pr-sfGFP-Cdc42 sandwich (pWKD011 integrated) leu2 3,112 his 3 11,15
ywkd069 : New YWKD055c a W303 bem1\(\Delta\)::KanmX URA-Gal1pr-sfGFP-Cdc42 sandwich (pWKD011 integrated) MFAprHIS3 3,112 11,15
ywkd070 : YWKD070a,b,c New YWKD055c a W303 bem1\(\Delta\)::KanmX bem3\(\Delta\)::clonNAT URA-Gal1pr-sfGFP-Cdc42 sandwich (pWKD011 integrated) MFAprHIS3 3,112 11,15
ywkd038: RWS1421 Wedlich-Söldner Lab collection a W303 can1 1-100 his3 11,15 CDC42pr-myc-GFP-CDC42 YipLac204-MET-CLN2 cln1\(\Delta\)::HisG, cln2\(\Delta\), cln3\(\Delta\)::HisG (Reference for the native CDC42 expression)
Settings of the FACs experiment
Equipment-Model: BDFACSCelesta
Lasers: Alexa Fluor 488 at 495V
Flow Rate: 2ul/sec
Sample volume: 130ul
Plate: 96 well plate with flat bottom
# of events per well: 10000
FSC threshold:20000
FSC voltage: 407V
SSC volatge: 275V
Mixing volume: 65ul
Mixing speed: 200ul/sec
Nr. of mixes: 5
Actual procedure
1st Incubation , at 14:00 in 28012020 in 2% Gal.
Any tube was dense after 24 hours of incubation in 36C .
The most dense for ywkd065a.
Note: I did the washing step with CSM for ALL strains, including ywkd024 and ywkd038, by mistake. I hope this do not cause their future death.
2nd incubation , at 14:20 in 29012020 in the respective galactose concentrations.
I added to each 5ml tube , 10 ul of culture, already resuspended down to 80ul , 320ul and 1.2mL. The different volumes are to account for differences in densities (size of the pellet). The 1.2mL was used for ywkd065, and the 80ul was used for ywkd024, ywkd038 and ywkd001. The 320ul for ywkd069 and ywkd070.
At 13:30 the experiment started.
59.4. Results#
59.4.1. Plate data#
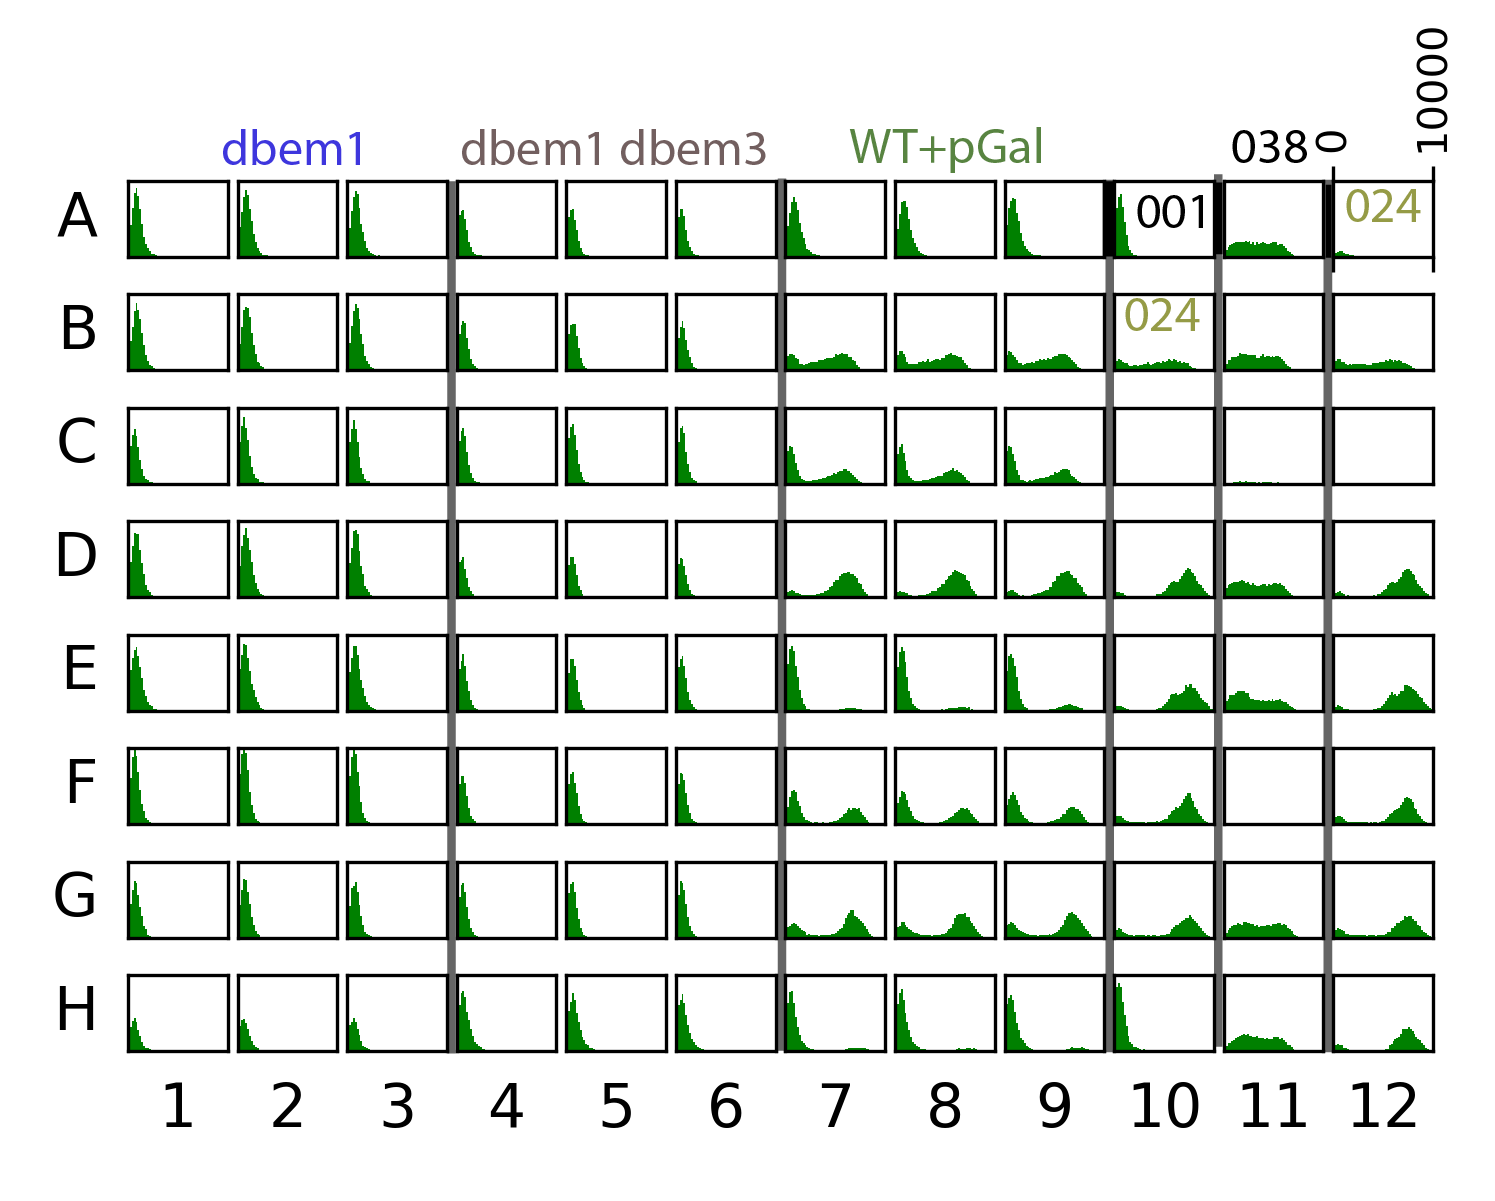 {#fig:plate width=50X}
59.4.2. Box plots#
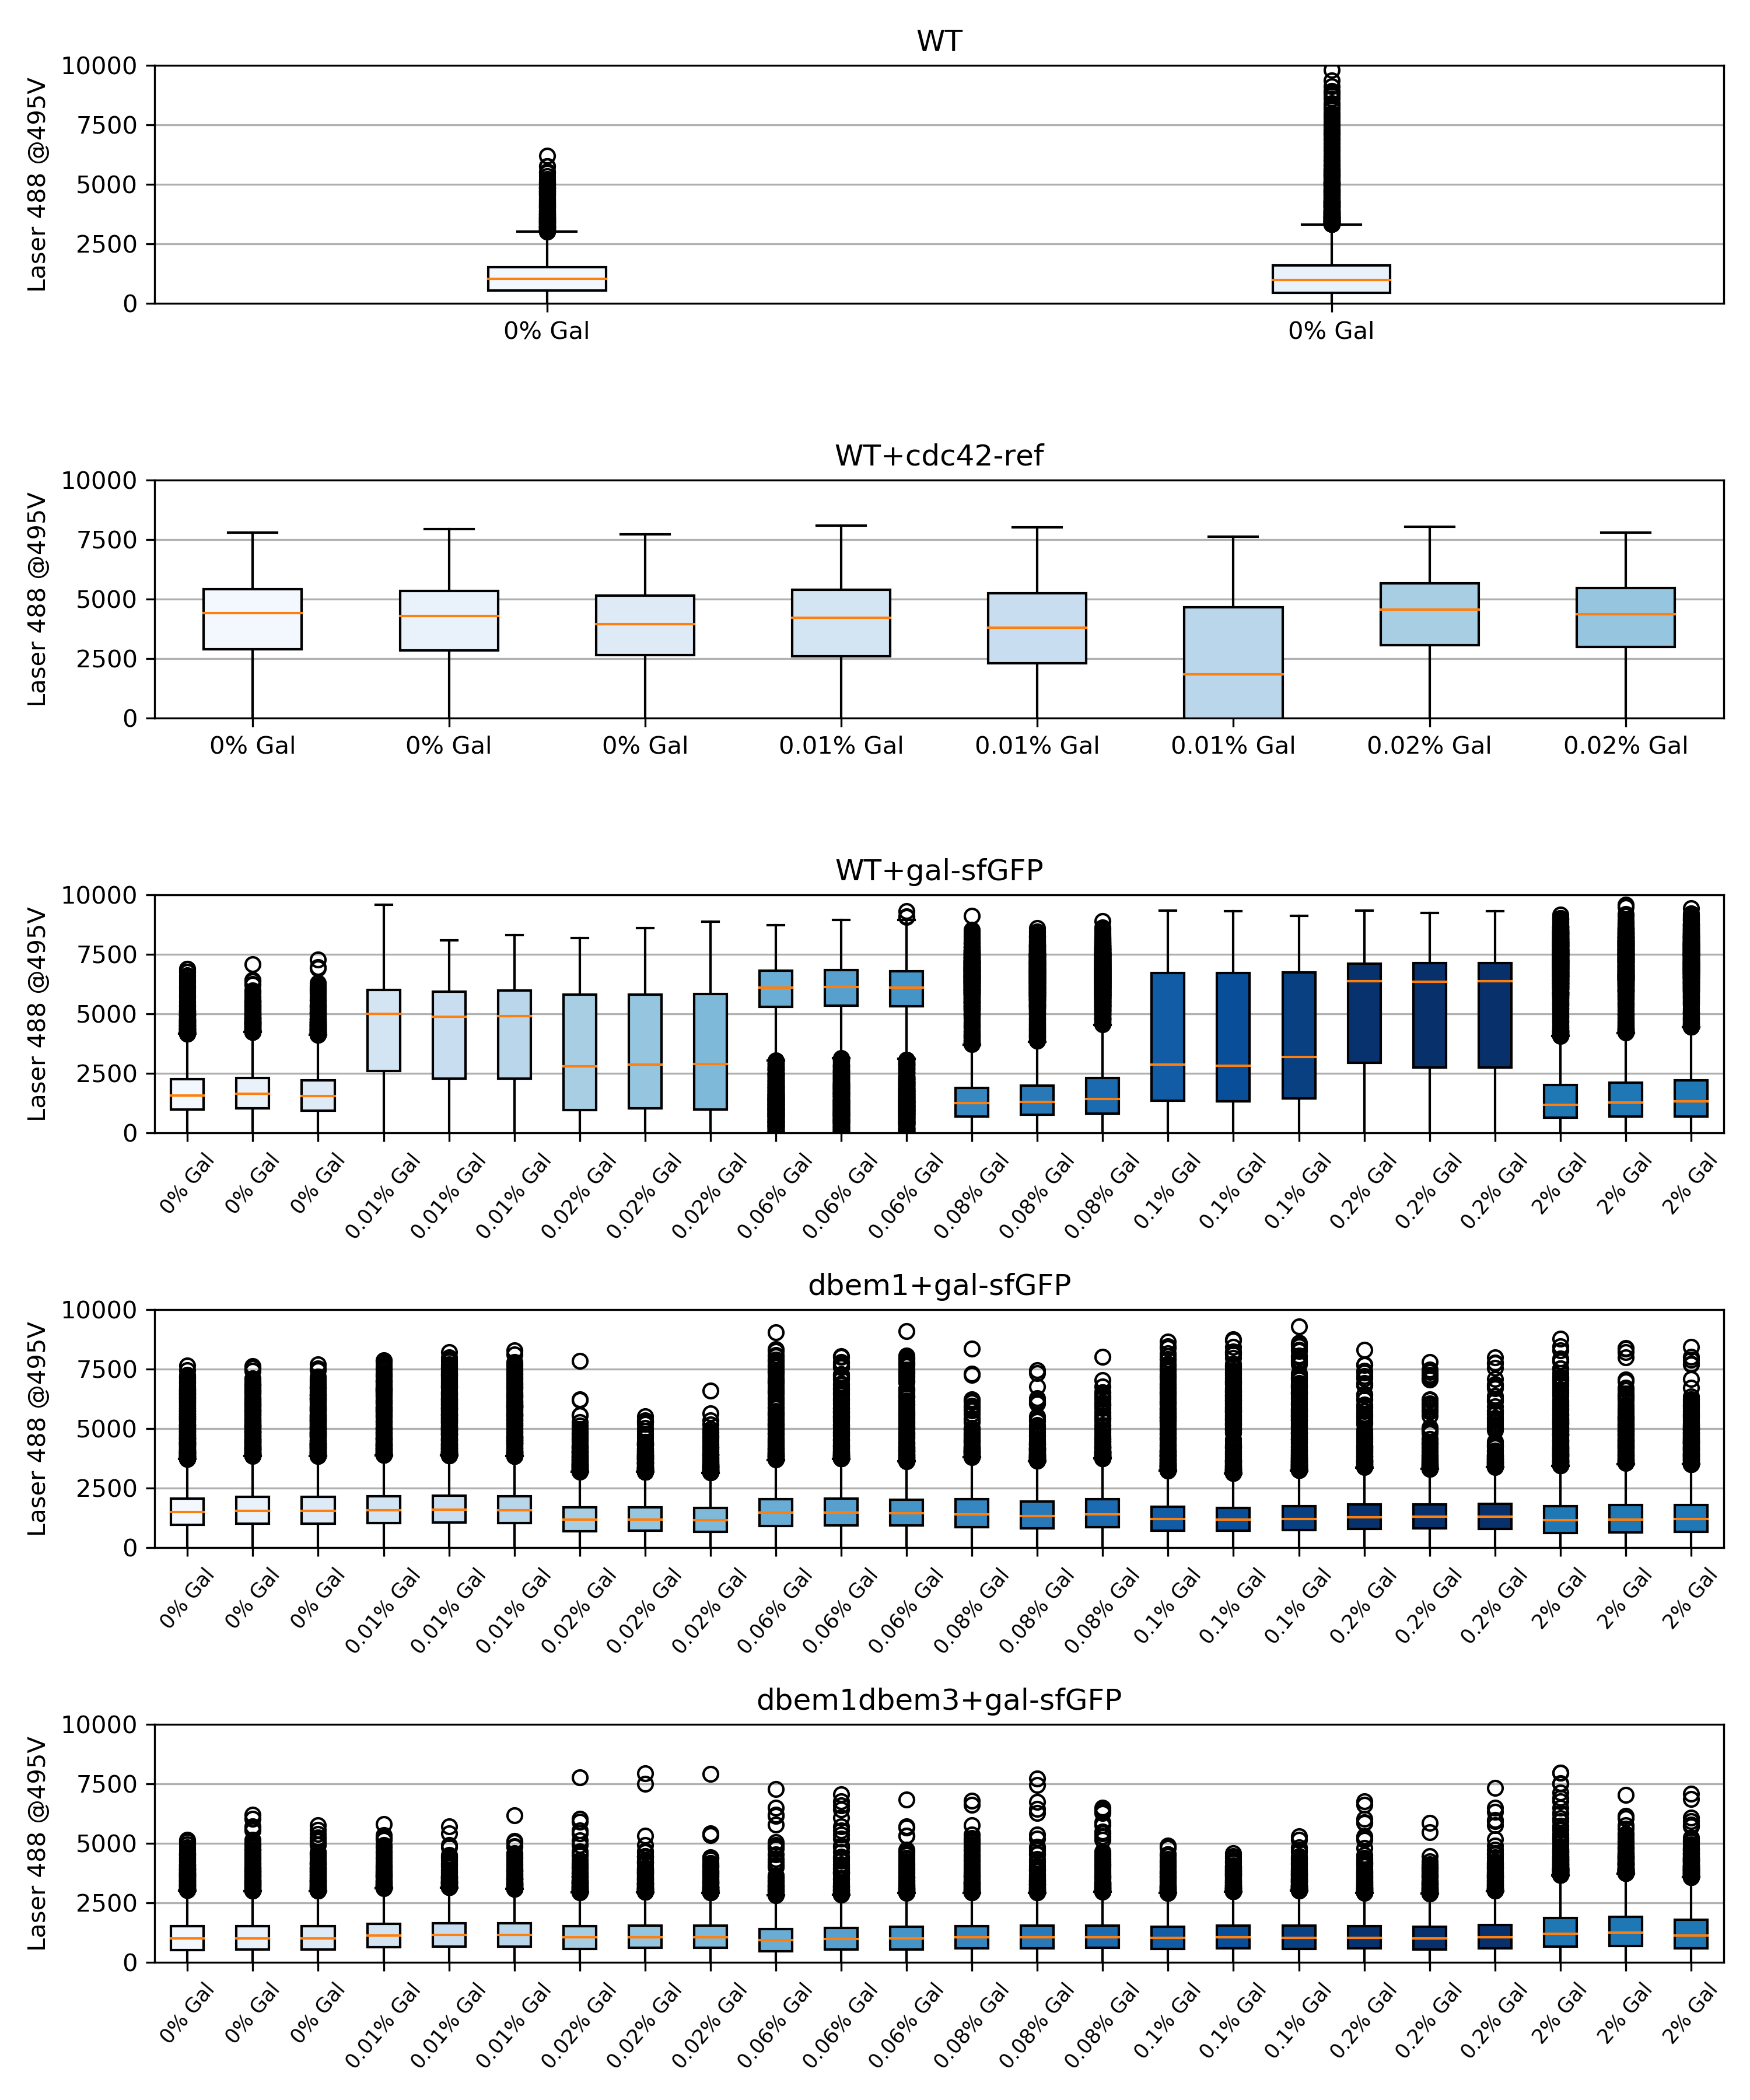 {#fig:Boxplots width=50X}
59.4.3. Measure per strain#
The measure per strain consist on computing the geometric mean of each technical replicate, and then compute the average of these values to give an estimate per strain per condition.
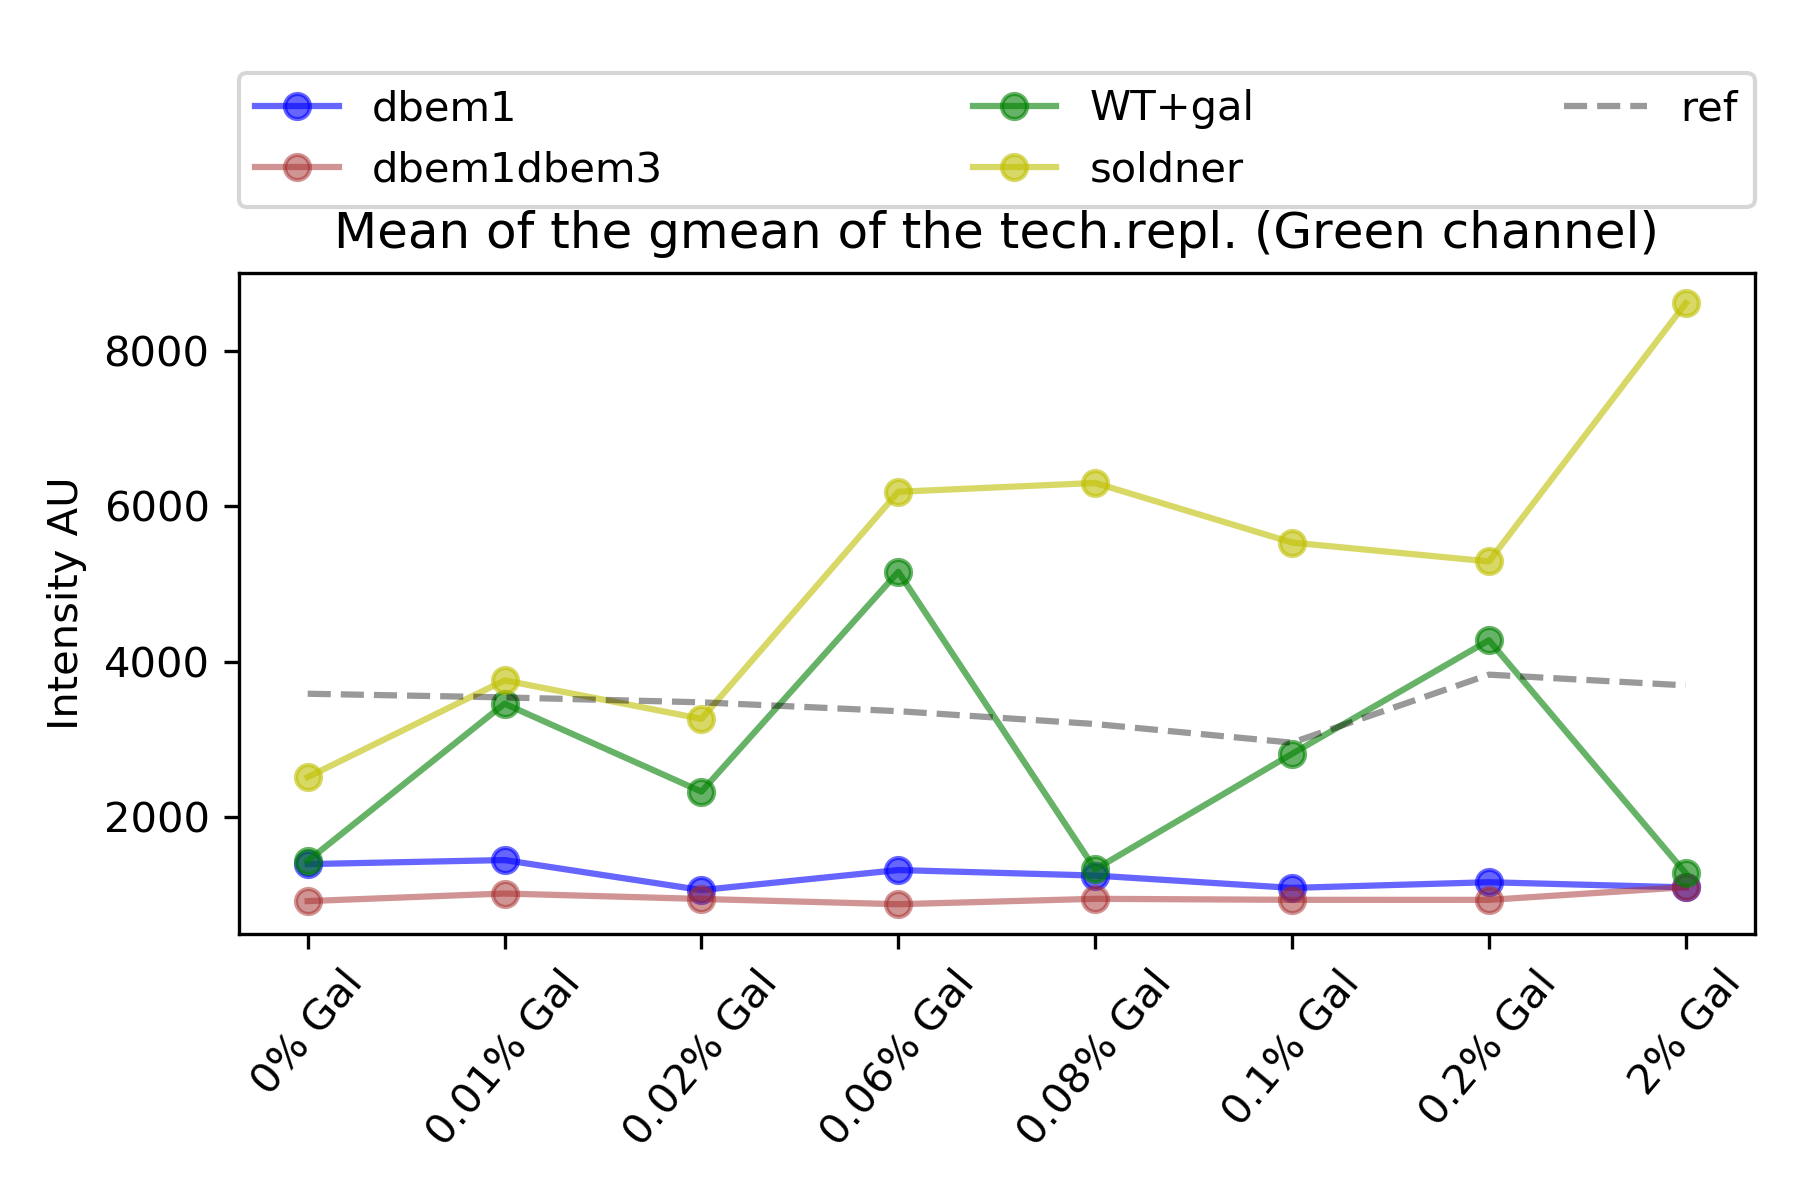 {#fig:means width=50X}
To know if these drops were real or due to the some weird behaviour of the FACs machine, I measure the OD of the cells (on 31012020 at 13:30) that luckily they were still in their incubation tubes, on the lab bench , at room temperature, without shaking.
I expected to see also a drop in their optical density in the same galactose concentrations were the drop in expression is perceived, if these drops are real, that is, due to the little concentration of cells.
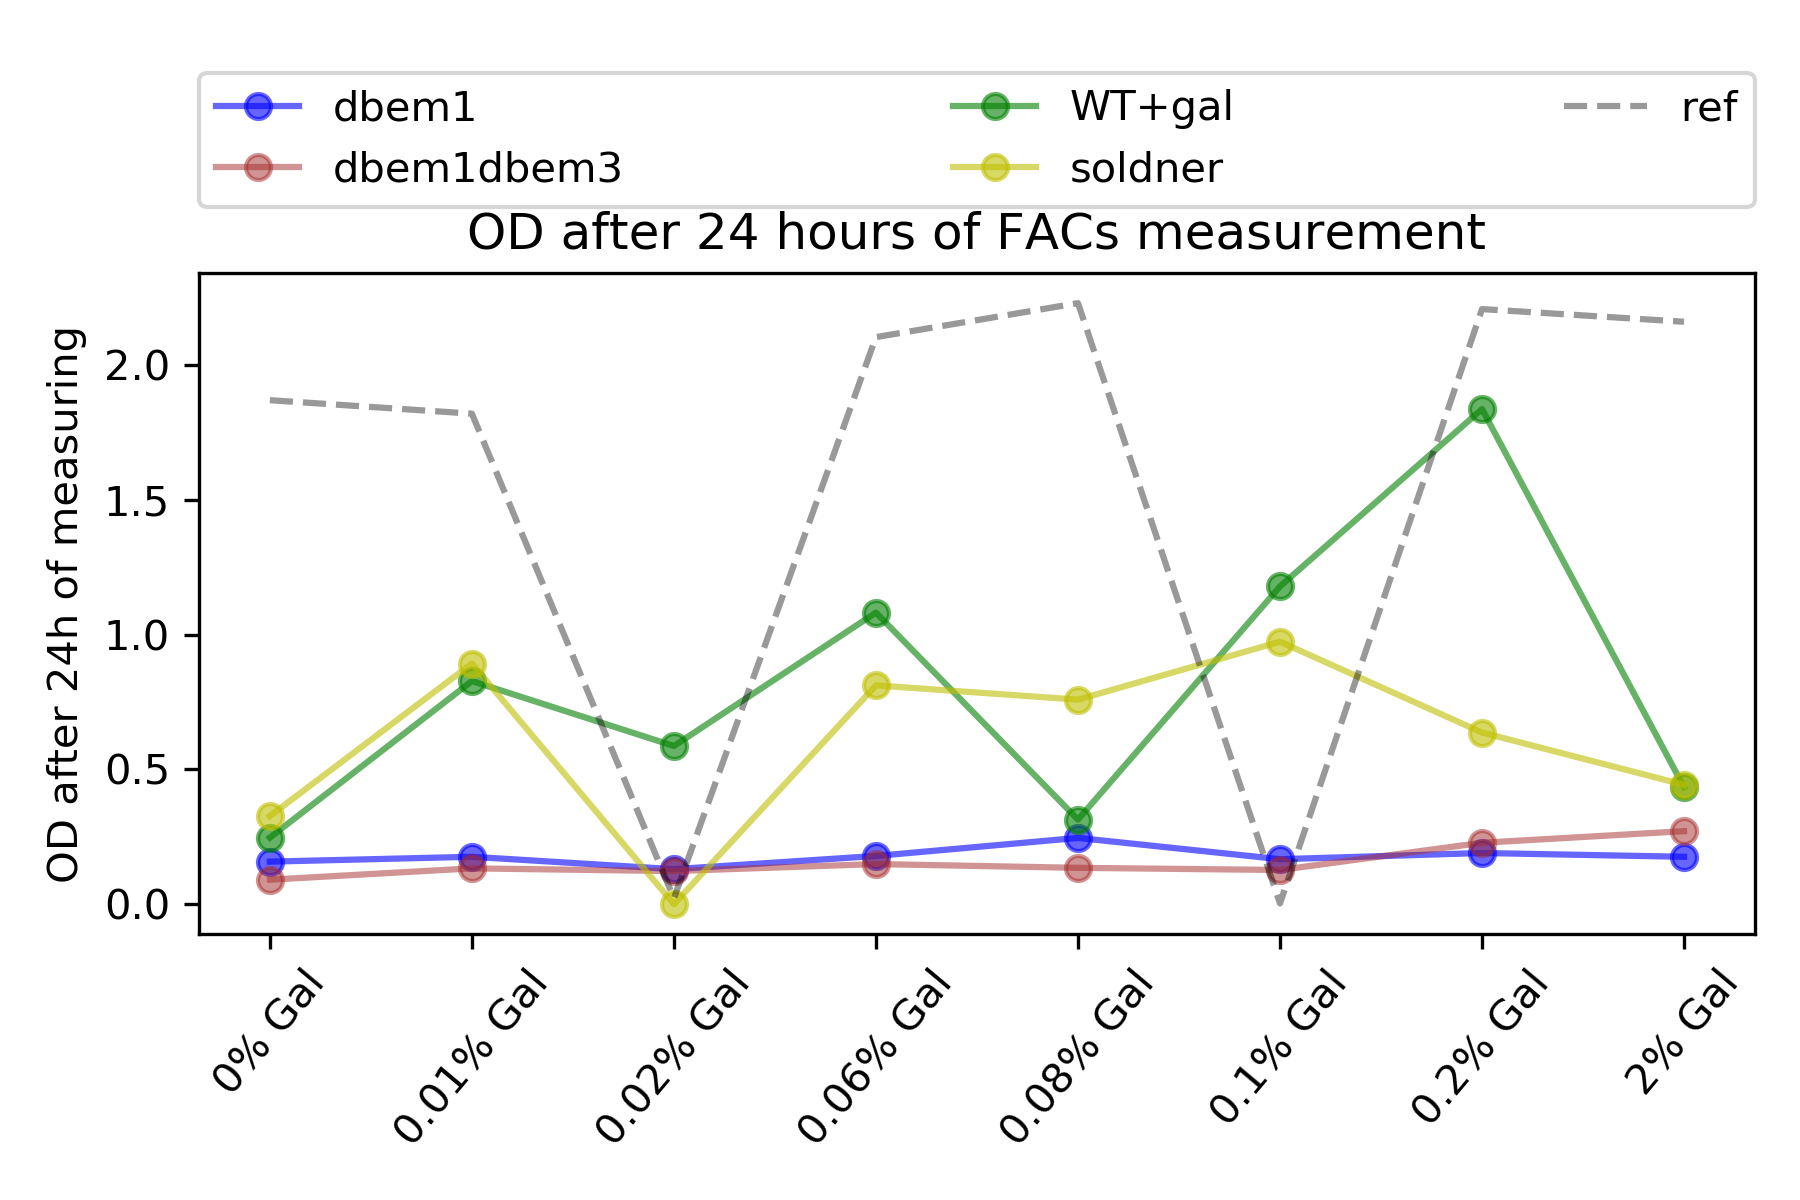 {#fig:OD width=50X}
Indeed :), there were also drop in the optical density on those galactose concentrations, namely, 0.02% , 0.08% and 2% for the WT+Gal strain. I also see that the mutants dbem1 and dbem1dbem3 were really miserable like I saw in the expression.
Maybe something weird happened from the incubation… (??)
59.4.4. Cdc42 relative expression#
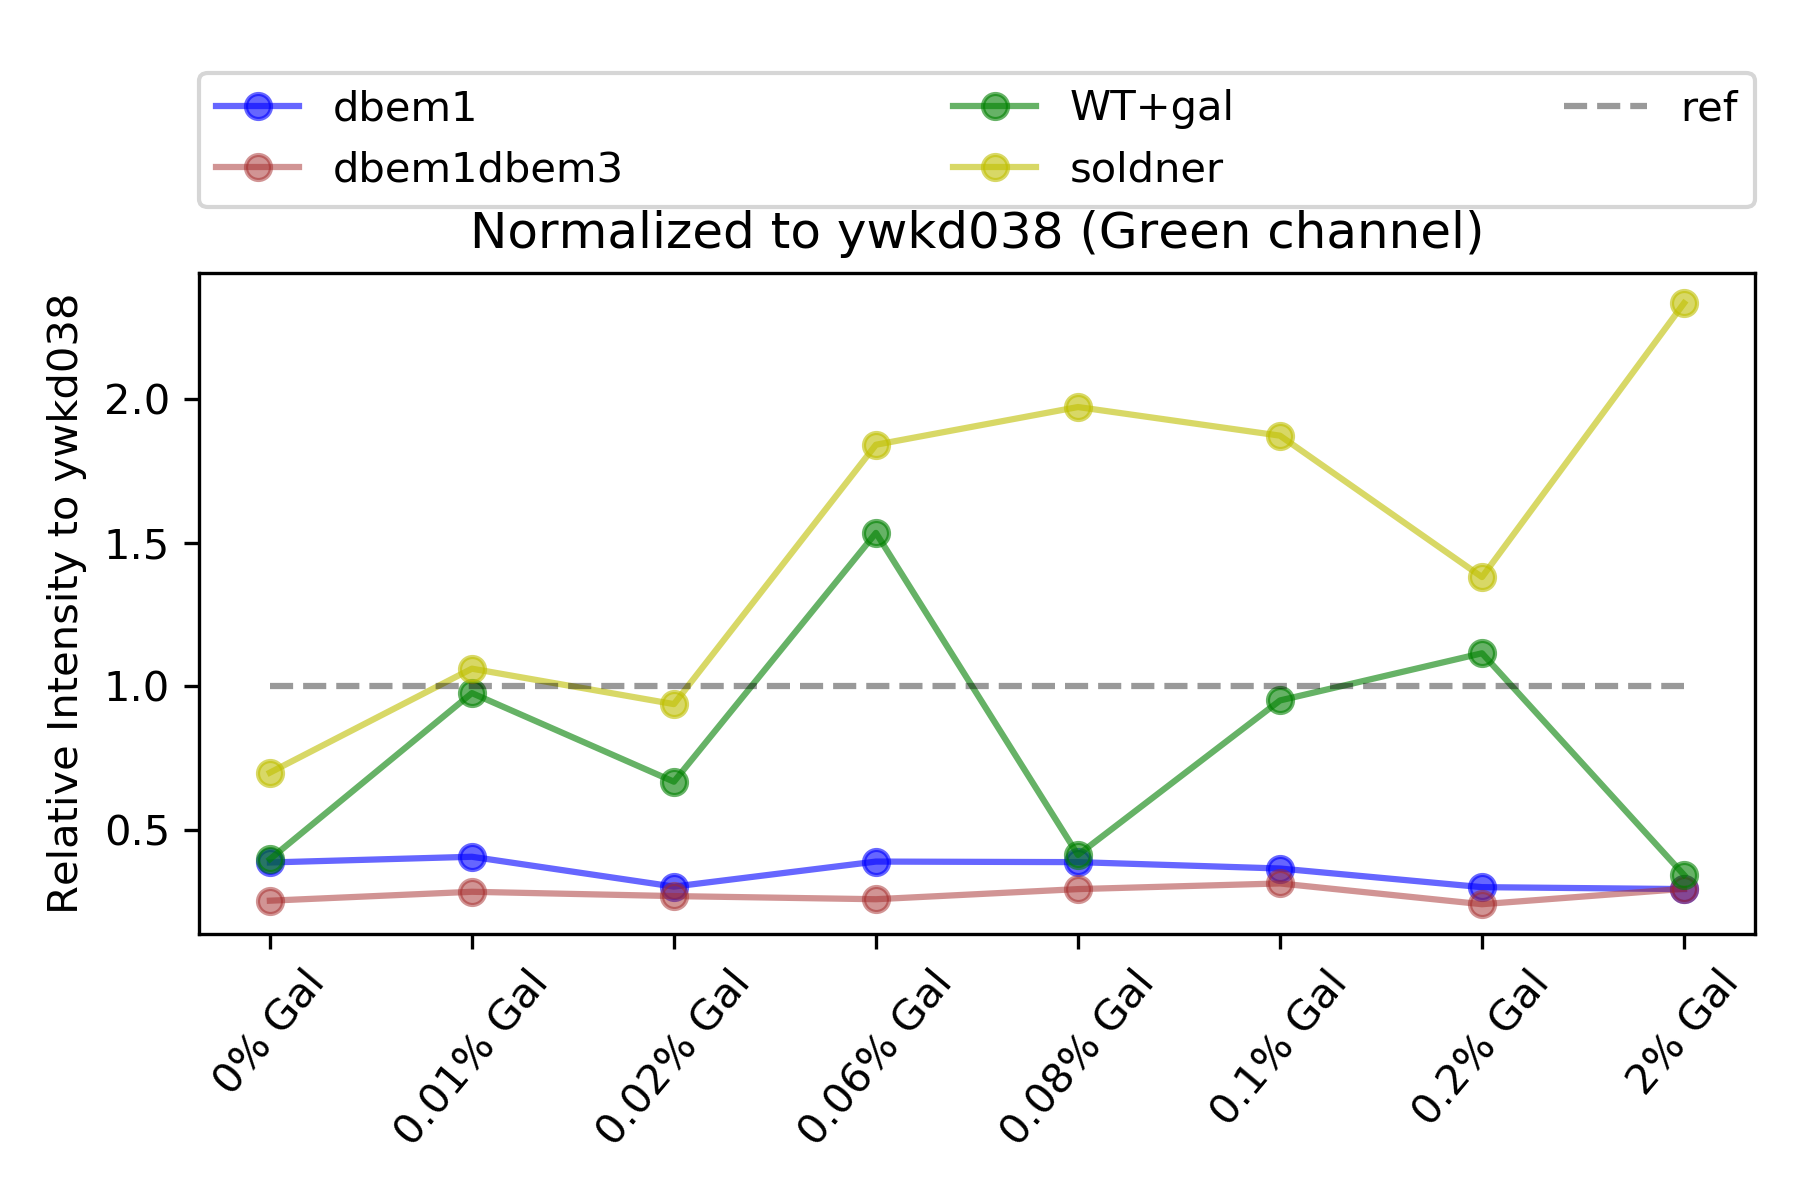 {#fig:relative-to-cdc42 width=50X}
59.4.5. Total counts#
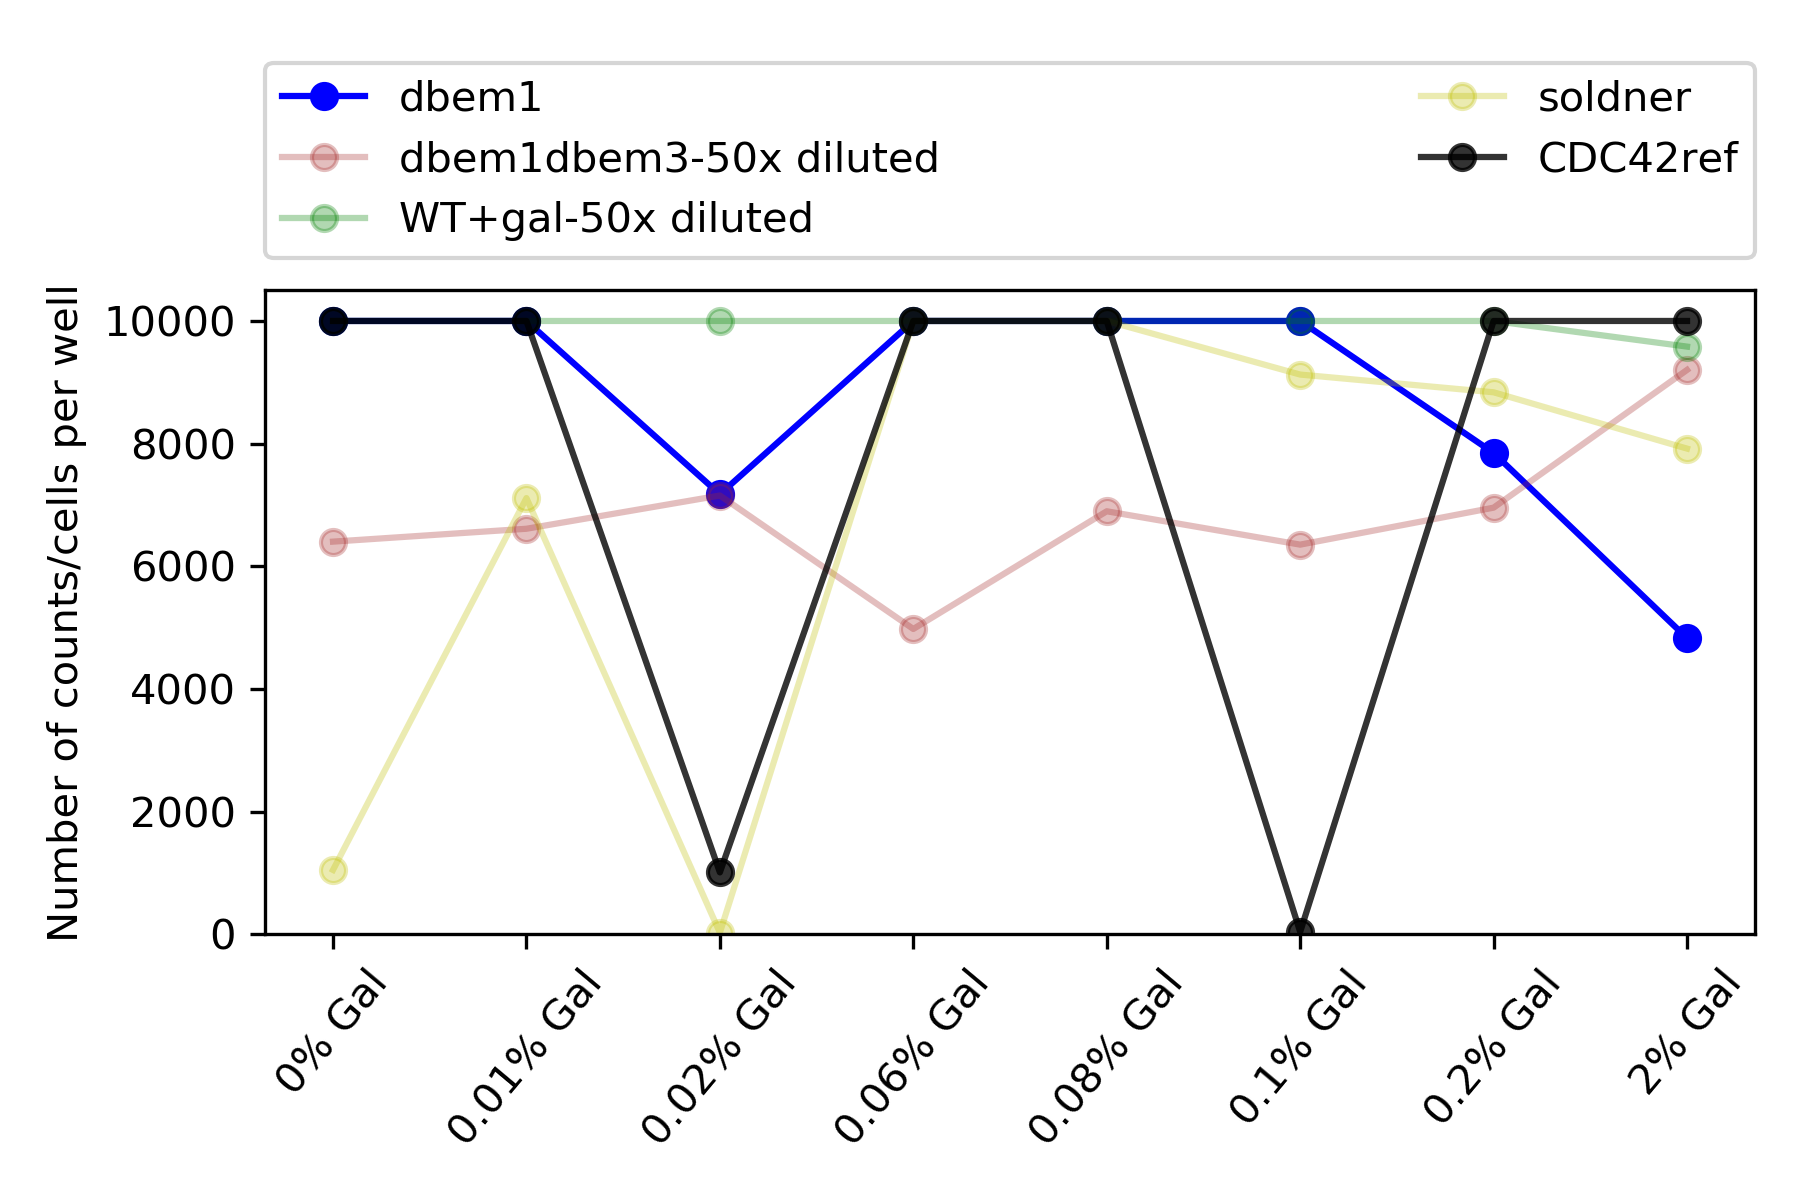 {#fig:total-counts width=50X}
59.4.6. Correlation between the GFP and sfGFP fluorophuores#
 {#fig:correlation-fluorophuores width=50X}

 {#fig:correlation-in-0.1 width=50X}
59.5. Conclusion#
This dataset had some weird/unexpected behaviour:
The wild type expression is not steadily increasing with galactose concentrations. At 0.08% and 2% there are “drops” of expression.(See @fig:means)
The mutants dbem1 and dbem1dbem3 have extremely low expression this time that never surpasses the native level. (See @fig:relative-to-cdc42)
