Title :What are the output channels from flow cytometry actualling telling us about the fluorescence of every cell?
Contents
55. Title :What are the output channels from flow cytometry actualling telling us about the fluorescence of every cell?#
55.1. Date#
21022020
55.2. Objective#
To describe the process of measuring and data collection by the BDFACSCelesta, in order to have a better overview of the information encoded in the height, area and width channel.
55.3. Method#
Learned by searching in the literature
Digging into the technical inspector of the instrument, to know the exact values of important parameters. (area scaling factor, window extension time)
55.4. Results#
From a technical sheet of the BDFACSCelesta :
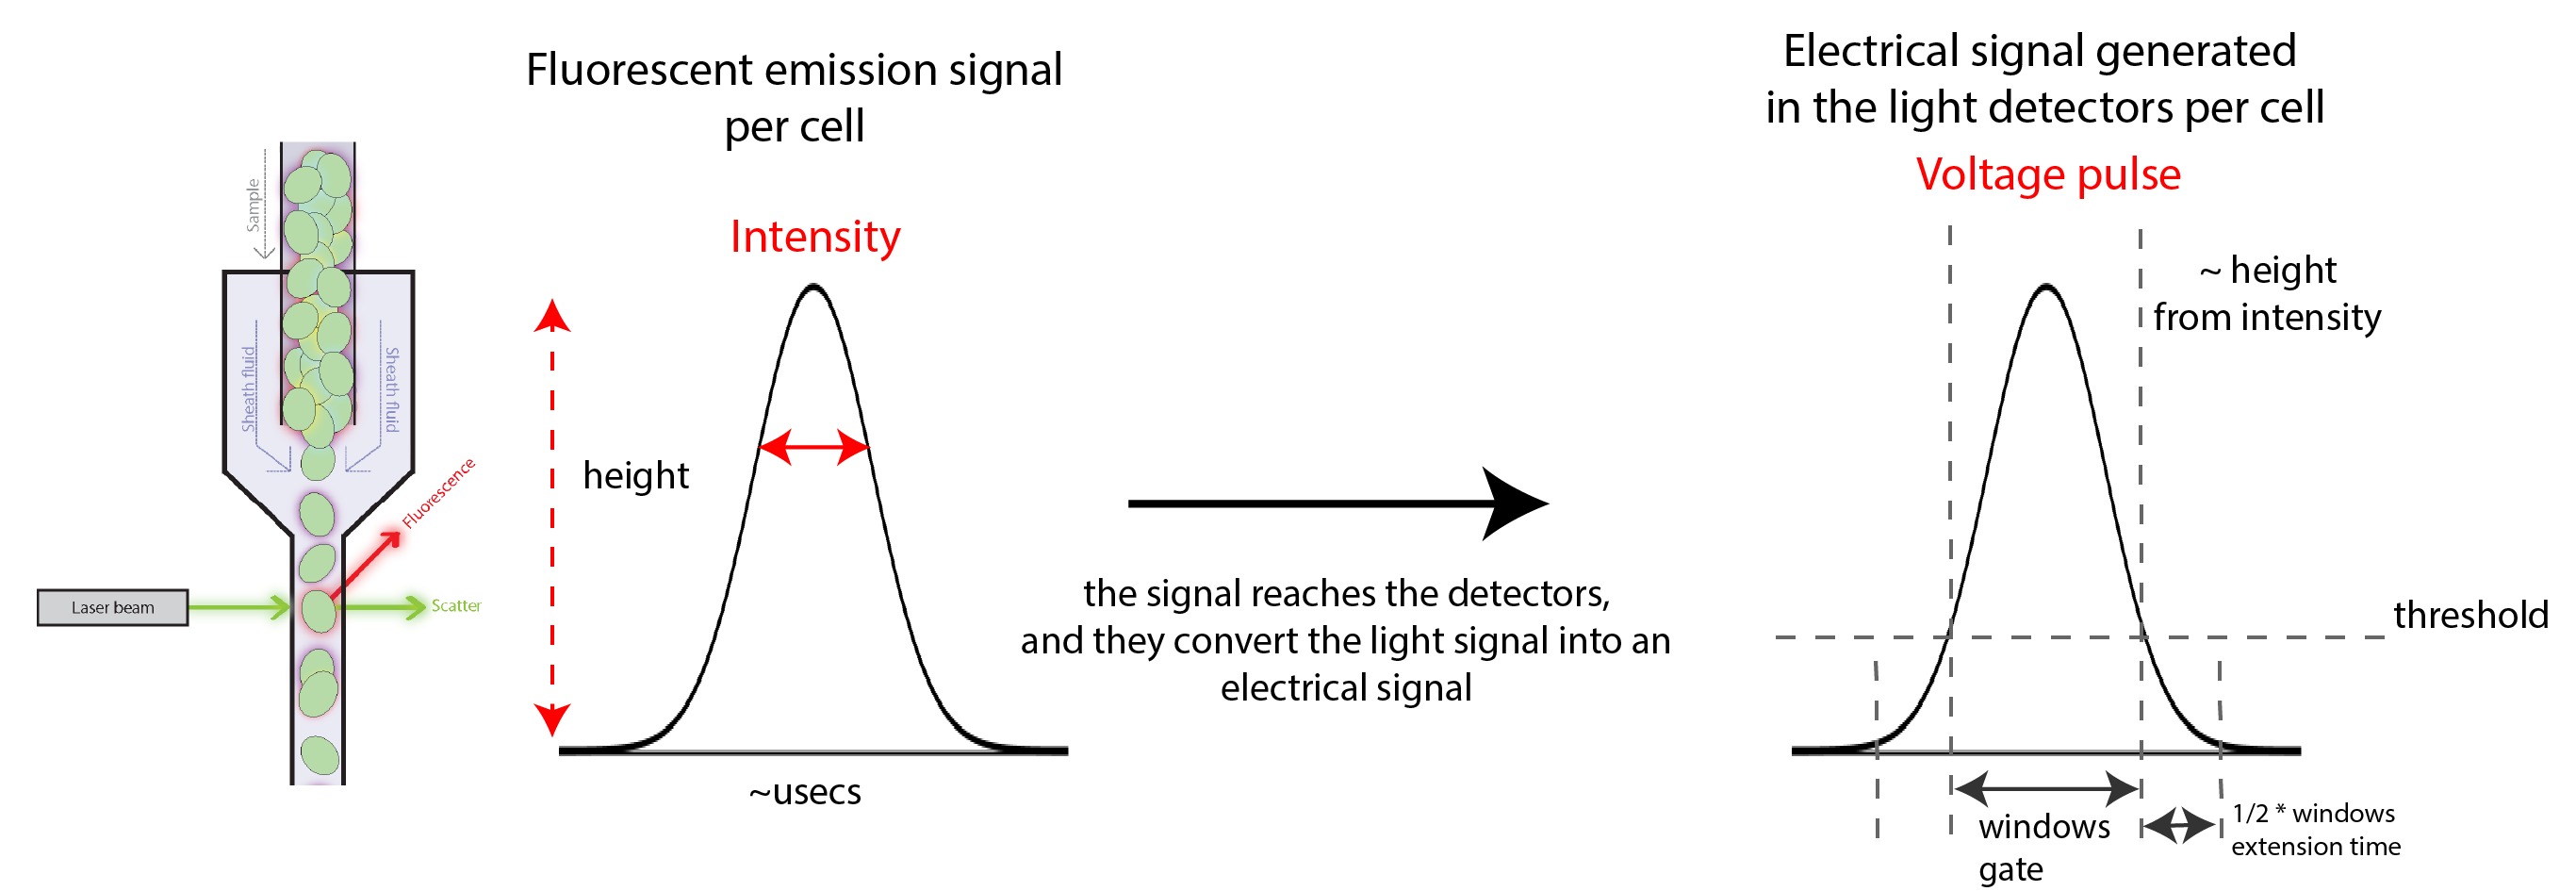
Pulse: As cells or other particles pass through a focused laser beam, they scatter the laser light and can emit fluorescence. Because the laser beam is focused on a small spot and particles move rapidly through the flow cell, the scatter or fluorescence emission signal has a very brief duration—only a few microseconds. This brief flash of light is converted into an electrical signal by the detectors. The electrical signal is called a pulse.
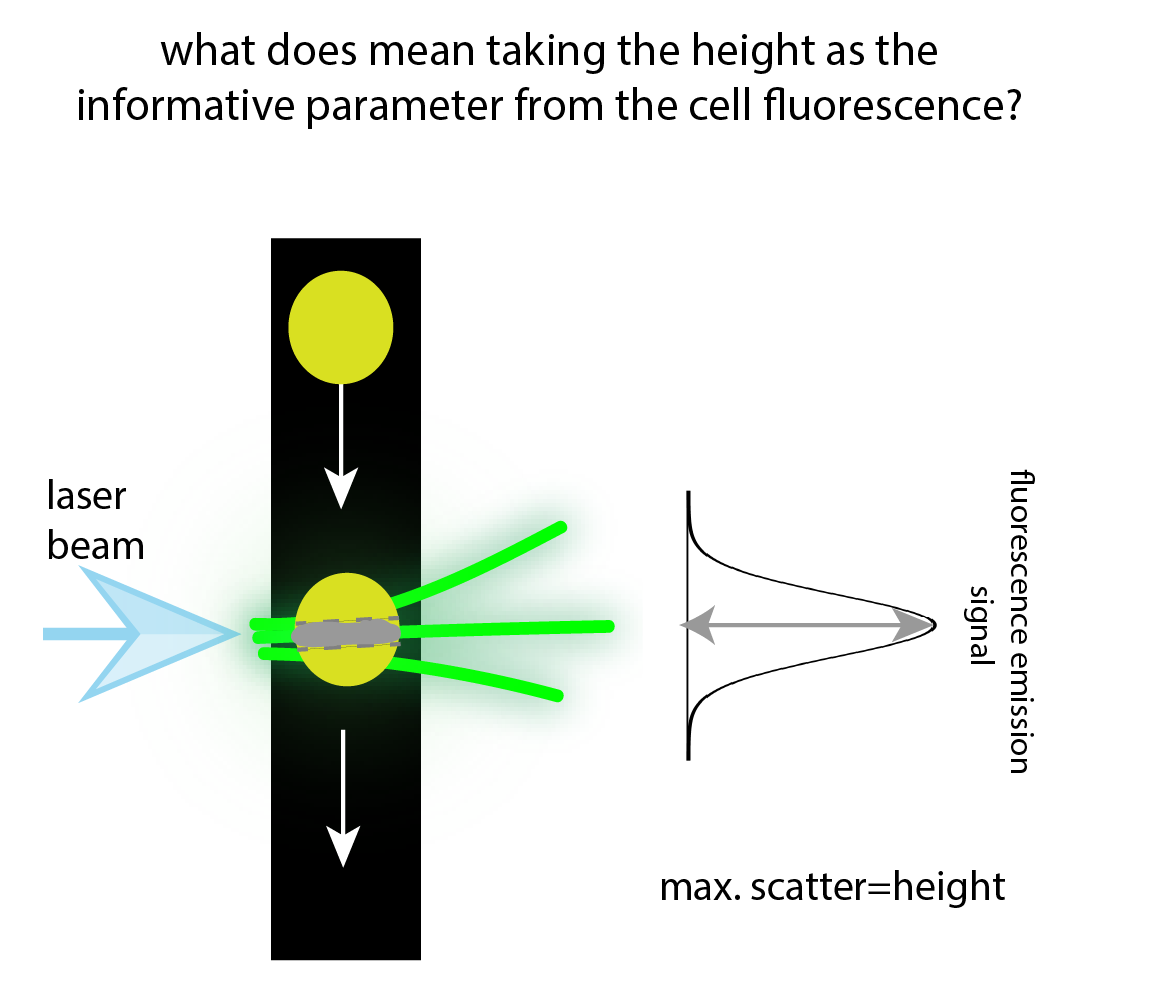
The pulse reaches a maximum intensity or height when the particle reaches the middle of the beam, where the beam and signal intensity are the brightest. The peak intensity, or height of the pulse, is measured at this point.
As the particle leaves the beam, the pulse trails off below the threshold.
The pulse processors measure pulses by three characteristics: height, area, and width.
Height: The maximum digitized intensity measured for the pulse.
The height does not depend on the cell size, and neither the flow rate of the cells through the laser beam.
The height from the electrical pulse (Voltages), after the conversion of the fluorescence emission signal by the detectors and photomultipliers, is proportional to the real height from the emission signal (Intensities).
The height value from the electrical pulse is only dependent on the voltages set by the user.
The height gives the total fluorescence of a portion of a cell. Given the fact we measure thousands of cells the effects of the cell cycle , on the fluorescence will be averaged out. And since we want the relative production compared with a control , those effects will be cancelled out.
For example if the center of the cell happen to have a polarization spot ,then the height will rise, but wont be given due to an increase in galactose but because all the GFP molecules are localized there.
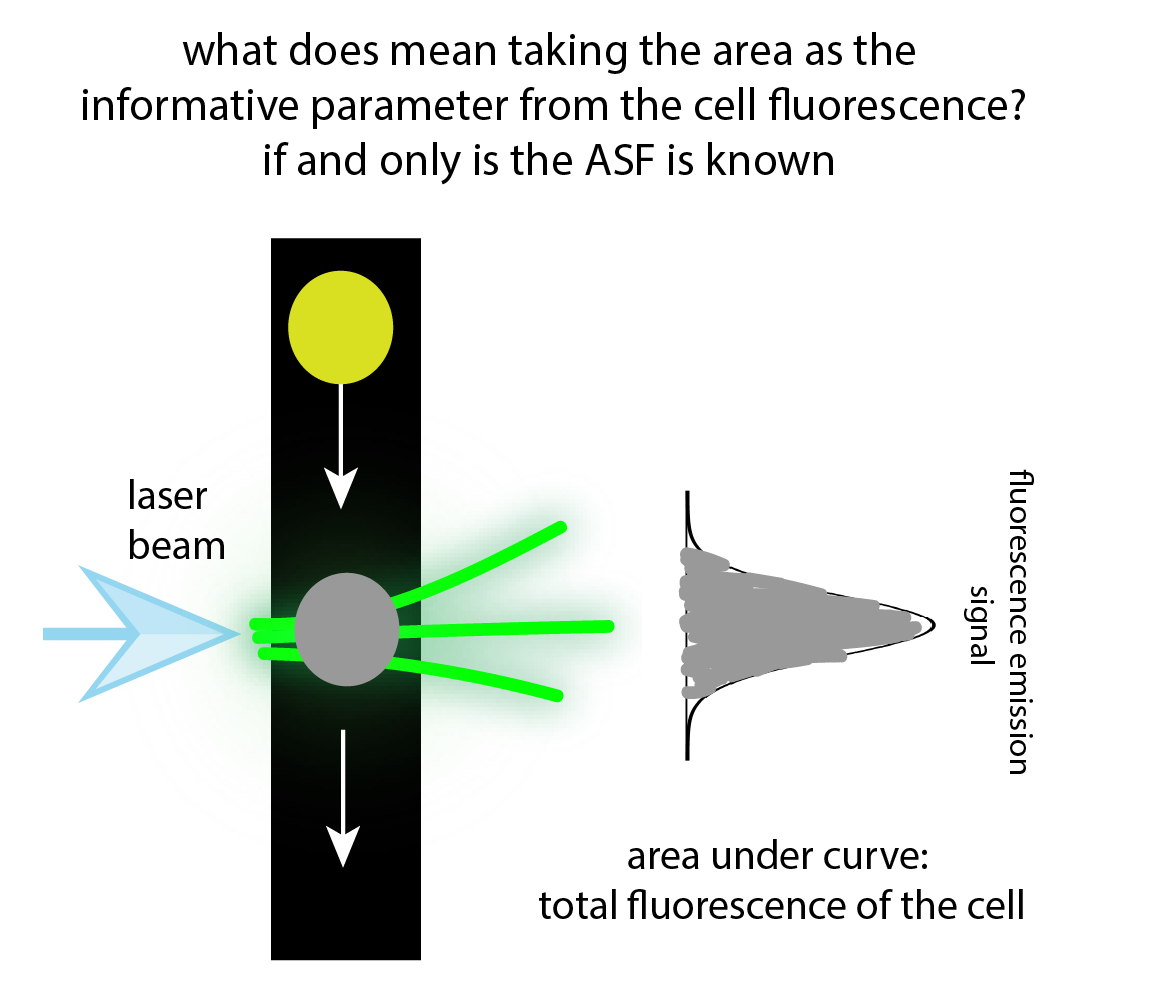
Area :The integration of all the digitized samples over time, where time is the window gate plus 1/2 the window extension added before the initial threshold, plus the other half of the window extension value added after the pulse drops below the threshold. The window gate extends until the pulse is 75% of the initial threshold.
The area given by the electrical signal depends on many parameters, like :
the area scaling factor (0.84 for the blue laser, 0.71 for the FSC)
the windows extension time (10usecs in our setup). The maximum possibly set is 25usecs.
The voltages of the photomultipliers
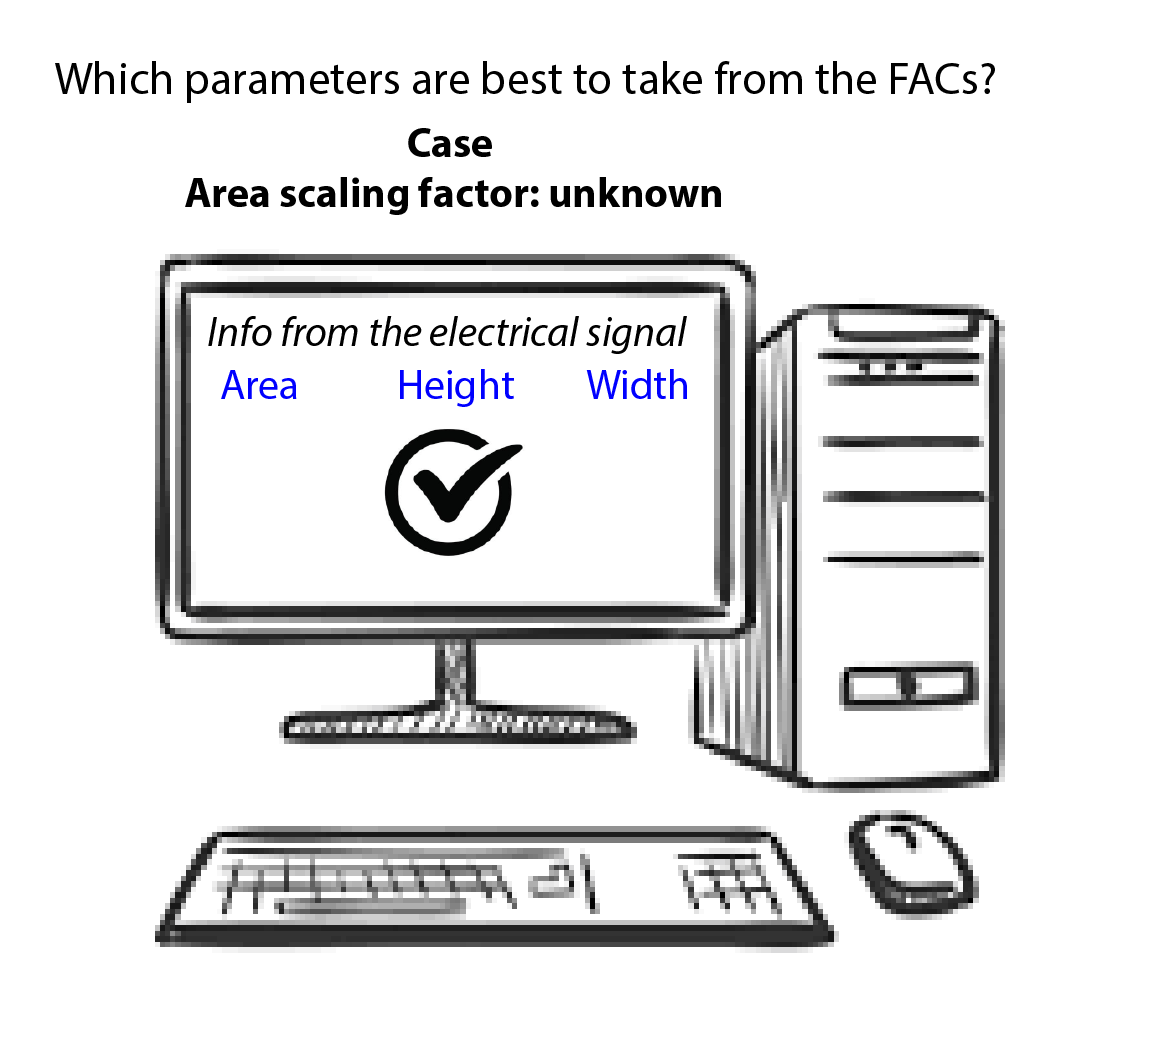
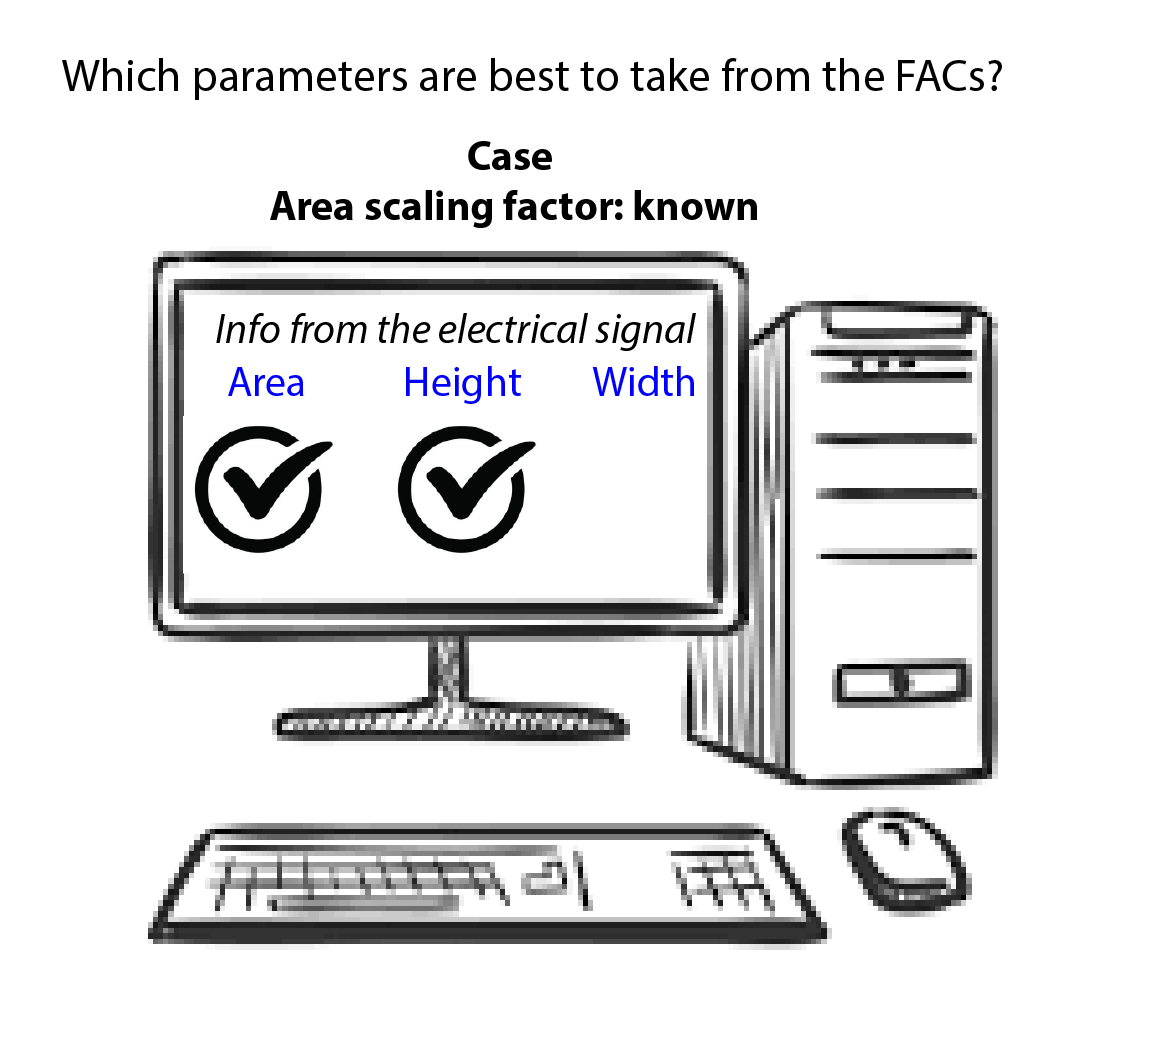
Important note: If the area scaling factor is not calibrated before each experiment such as the area measurement is always proportional to the height of the signal, then the area given by the instrument does not reflect a real integration over time of the intensities of the cell . hence the area is not a measure of the total fluorescence of the cell in the case the area scaling factor is not calibrated before.
Width : The current width is measured by the electronics. This system does not directly calculated the width of the light signal.
Threshold: The threshold is the level at which the system starts to measure signal pulses. A threshold is defined for a specific detector signal. The system continuously samples the digitized signal data and calculates pulse area and height for all channels based on the time interval during which the threshold is exceeded
 {#fig:signal}
 {width=50%}
 {width=50%}
 {width=50%}
 {width=50%}
55.5. Conclusion#
In general , what it is best is to take the histograms based on the height of the fluorescence signal for further data analysis.
