Title : how do yeast cells look like during log phase at different galactose concentrations? (experiment)
Contents
8. Title : how do yeast cells look like during log phase at different galactose concentrations? (experiment)#
8.1. Date#
24102022 (Monday)- 27102022 (Thursday)
8.2. Objective#
Show that during log phase yeast cells with the gal promoter look OK at different galactose concentrations.
Genotypes:
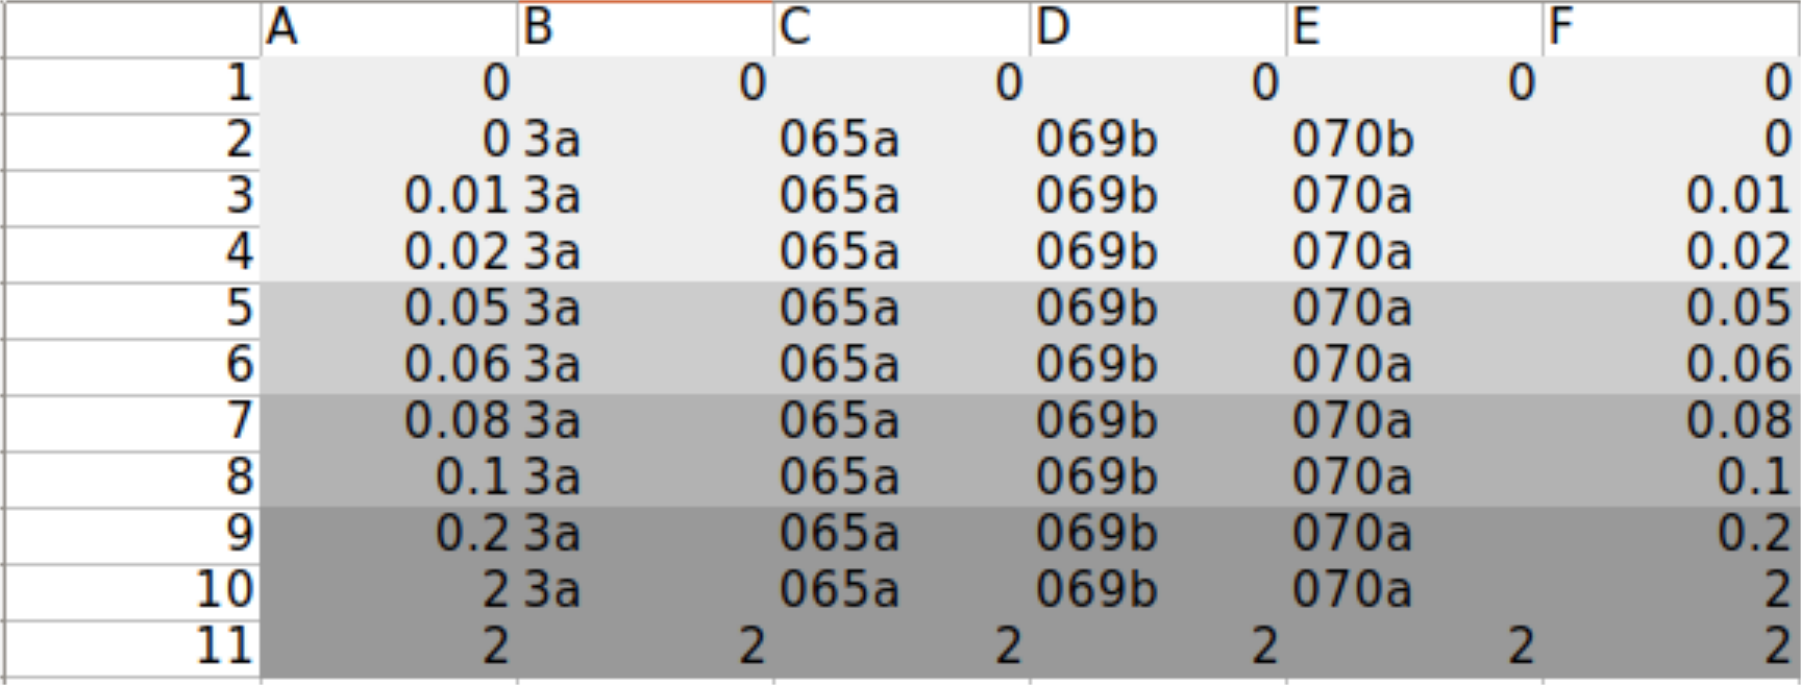
WT+sfGFP+pGal-CDC42(ywkd065a)
dbem1+sfGFP+pGal-CDC42(ywkd069b)
dbem1dbem3+sfGFP+pGal-CDC42(ywkd070a)
WT(yll3a Control)
Gal concentrations:
0%, 0.01%,0.02%,0.05%,0.06%,0.08%,0.1%,0.2%,2%
8.3. Method#
Population growth measurements in 0,0.01,0.02,0.05,0.06,0.08,0.1,0.2,2% galactose for the following strains: WT+sfGFP+pGal-CDC42(ywkd065a),dbem1+sfGFP+pGal-CDC42(ywkd069b),dbem1dbem3+sfGFP+pGal-CDC42(ywkd070a),WT(yll3a Control).
In the log phase of the measuring part take some bright field images of the cell morphology in the 96 well plate.
I transfer 50ul of cells to an 96 well imaging plate to take the bright field images.
No dilution of cells .
8.4. Results#
Plate layout

Incubation in 30C at 12 pm

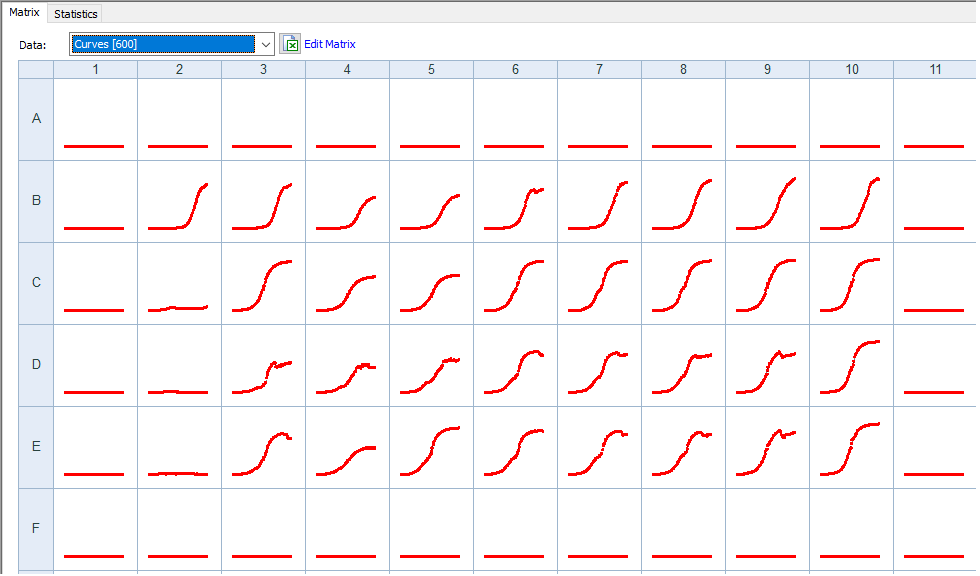
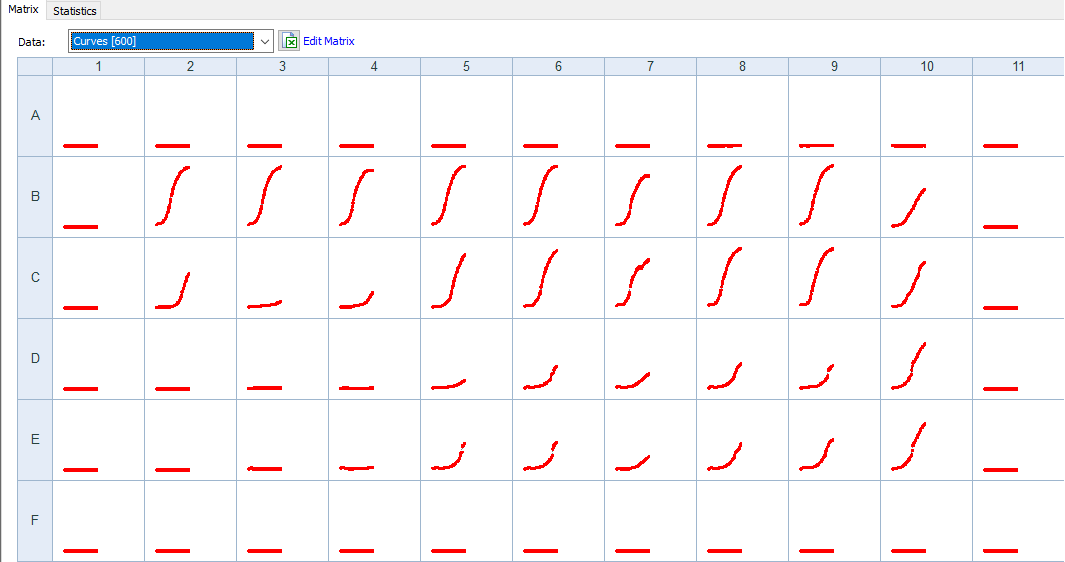
Measuring in 36C + 24h incubating in the biotek

Microscopy images


